Intelligent Alerting & Automation
Stay ahead of issues with AI-powered anomaly detection and automated remediation workflows that keep your infrastructure healthy.
Multi-Channel Alerts
Email, Slack, PagerDuty, webhook integrations for instant notifications
Learn moreThreshold-Based Alerts
Configure custom thresholds for any metric with flexible alerting rules
Learn moreAI-Powered Detection
Machine learning models identify anomalies before they become critical
Learn moreStackWatch Core Features
Real-time visibility across hosts, clusters, networks, storage, and customer VMs with lightweight agents for Linux and Windows.
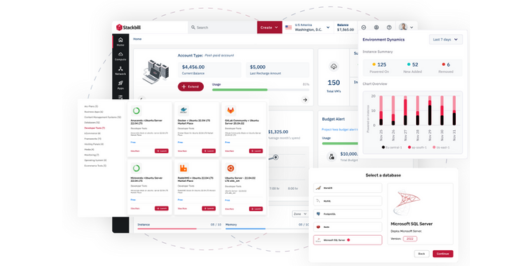
Unified Visibility Across Cloud and VMs
Get real-time visibility across hosts, clusters, networks, storage, and customer VMs with actionable insights.
Monitoring-as-a-Service for Customers
Offer monitoring as a value-added cloud service. Customers can enable VM monitoring on demand and access dashboards.
Built-In Monetization with StackBill
Seamlessly convert monitoring into revenue with StackBill integration. Define pricing per VM, metric, or usage.
Centralized Infrastructure & Log Intelligence
StackWatch Insights provides centralized visibility into the health, performance, and capacity of your cloud infrastructure.
Deep Infrastructure Monitoring
Monitor compute, storage, and networking components across Apache CloudStack, KVM, Ceph, and custom switches.
Advanced Metrics & Log Analytics
Prometheus and Grafana-based observability stack for high-resolution metrics, historical trends, and centralized log analysis.
Customizable & Extensible Observability
Extend monitoring to custom services and hardware using configurable exporters that adapt to your architecture.
All in one Integrated Solution
Stackwatch is an all in one solution that provides features that helps the users with auto-discovery of errors, automated healing of crashes, event logging, server request management and so on.
you can use Email, slack, Whatsapp or ay other third party Messenger to get alerts about your server through our server Monitoring System
See all integration

Ready to Monitor Smarter?
Get complete visibility into your cloud infrastructure with StackWatch's AI-powered monitoring.
Book a Demo
We'll walk you through a live demo of StackWatch tailored to your infrastructure needs.
Get a DemoStart Free Trial
Try StackWatch free for 15 days on your own cloud infrastructure with no commitment.
Get Free TrialConsult an Expert
Speak with our monitoring specialists to design the right observability setup for your platform.
Connect With Our Team